Tarmac or Self-Binding Gravel?
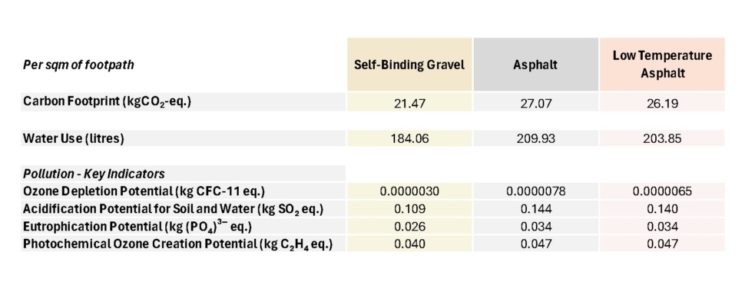
When annual maintenance is factored in, the environmental impact of self-binding gravel increases. However, the data show that it is still a more sustainable choice than asphalt – even over a 20-year period.
Both professional landscape designers and home gardeners have access to an enormous range of materials in today’s market. From locally-sourced natural stone to complex composites, there is a wealth of options for a variety of budgets, aesthetics and performance requirements. The wide range of options and greenwashing claims can make the choice overwhelming.
At MBLA, sustainability is fundamental to how we select materials. Wherever possible we use materials already on site, from reclaimed paving setts to waste concrete aggregate. When it is not possible to use site-won or reclaimed materials, we look for the next best sustainable alternative.
This holistic approach means delving into some fairly complex data to help support our decision-making. In this article we share how we do this and what we have found.
Guided by the Planetary Boundaries Framework, some key issues to look at are:
- Climate change – assessing the carbon footprint of a material over its lifetime, from raw material extraction and manufacture to installation, use and disposal. As well as carbon, consider how the colour and texture of a material can affect how much heat is absorbed or reflected.
- Fresh water change – assessing the ‘embodied water’ of a material. In a similar way to carbon, a material has a water footprint. Some materials use a huge amount of water in their manufacturing process, which we do not see as the end user.
- Biosphere integrity – as well as the impact on wildlife when manufacturing a product (such as the effect of a quarry or a tarmac plant on the surrounding flora and fauna), consider how different materials will affect biodiversity in the garden. A gravel surface, for example, provides more niches for small invertebrates than a tarmac path and will naturally become part of the soil structure as it degrades. It is often difficult to measure the total biodiversity impact of a material. Although not yet scientifically quantified, there is potential for tarmac to leach chemicals into the surrounding soil, especially in hot weather.
- Stratospheric ozone depletion – CFCs and other chemicals destroy ozone high in the stratosphere. Where data is available, look at the relative ozone depletion potential of a material across its lifetime.
- Atmospheric aerosol loading – Volatile Organic Compounds (VOCs) released during the lifetime of a material produce ozone at ground level. Where data is available, look at the Photochemical Ozone Creation Potential (POCP) of a material to quantify this.
- Ocean acidification and eutrophication – an overabundance of nitrates, phosphates and other nutrients can leach into watercourses, so look at measurements of a material’s potential to contribute to this.

Sources:
Environmental Product Declarations (EPDs)
Information on the environmental impact of materials is still patchy. Some suppliers are very transparent, whilst others have very little publicly available data. In many cases it is necessary to make assumptions grounded in an understanding of the material and its use.
Environmental Product Declarations (EPDs), where available, are excellent sources of information. An EPD presents the results of a Life Cycle Assessment (LCA) of a material or product in a standardised format. A range of environmental impacts are reported, from carbon footprint to water use.
An LCA evaluates environmental impacts from raw material extraction to finished product, as well as looking at the ‘usage’ stage and end of life (removal and disposal). It also often incorporates a measure of recycling or re-use potential, for instance the carbon emissions offset by re-using rather than re-manufacturing. EPDs are either produced internally or by external consultants following the LCA methodology. Importantly, they are then verified by an approved independent verifier before being published.
Method:
Comparing footpath surfaces
So how can we measure the environmental impact of surfacing a footpath with self-binding gravel compared to surfacing it in asphalt or tarmac?
Step 1: Gathering the data
We obtained EPDs for an asphalt mix, gravel and aggregate, and a geotextile sheet. These provided environmental impact data for each tonne of material. EPDs are generally available from a supplier’s website and a quick internet search should give you options. Occasionally they need to be requested directly from a manufacturer, but should be free of charge.
Step 2: What materials are needed for each type of footpath?
We considered the build-up for one square metre of the two options.
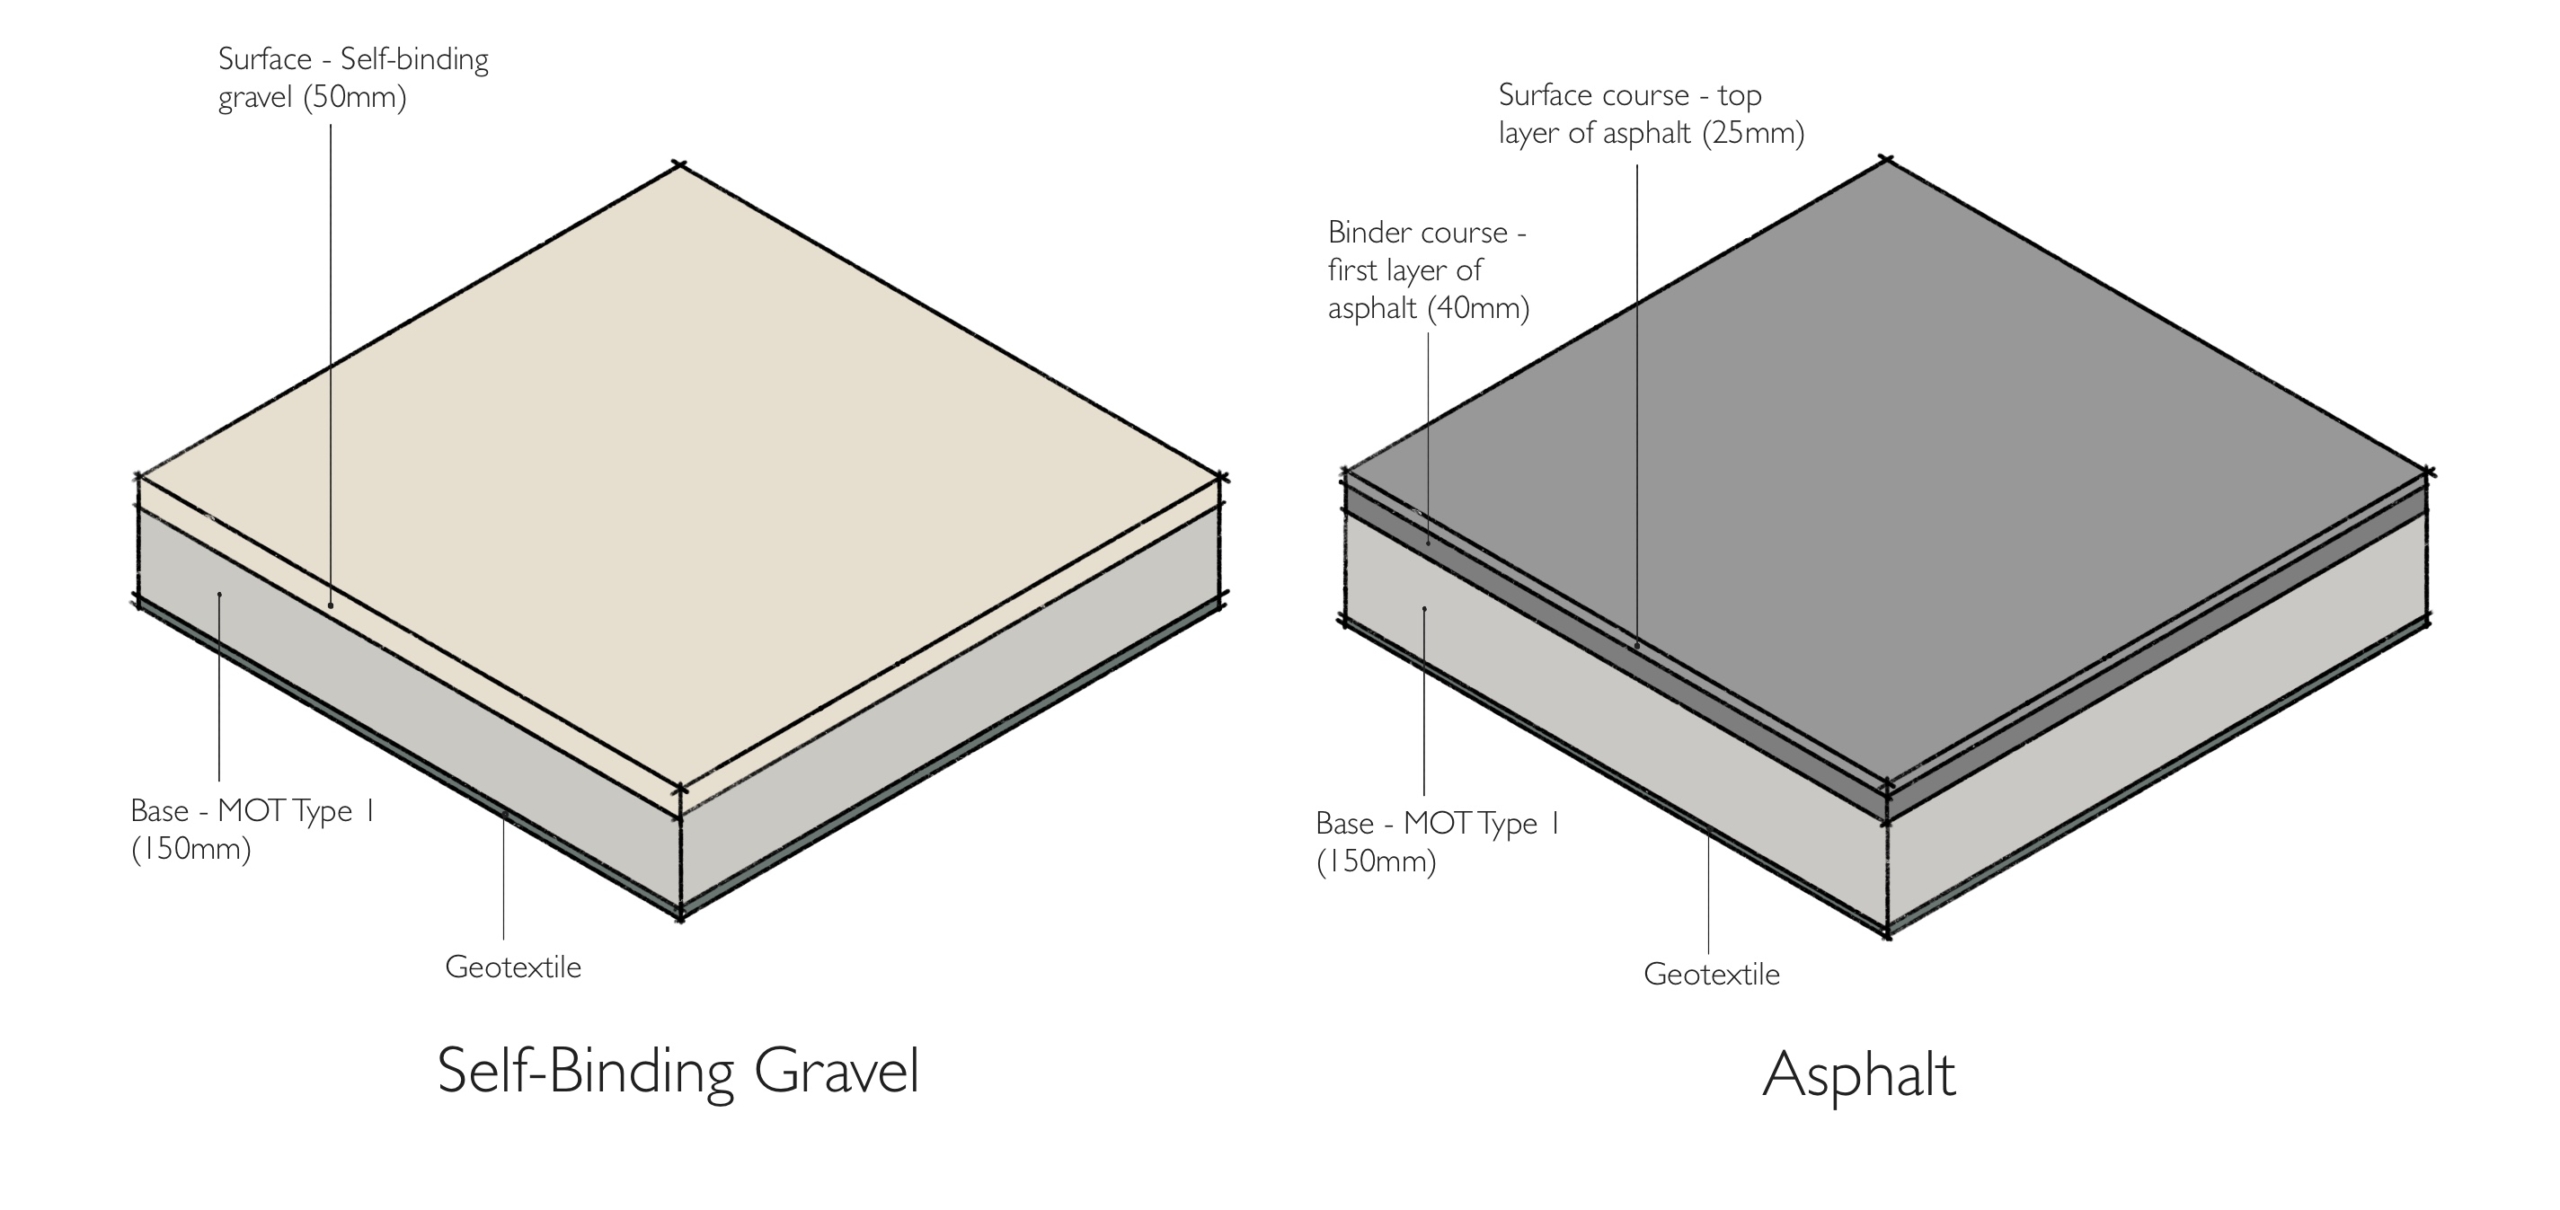
A self-binding gravel footpath would typically consist of 5cm compacted gravel, laid on top of a 15cm base of crushed aggregate, with a geotextile sheet beneath.
An asphalt footpath would typically have a 2.5cm ‘surface course’ of asphalt on top of a 4cm ‘binder course’ of asphalt, laid on a 15cm base of crushed aggregate and geotextile sheet.

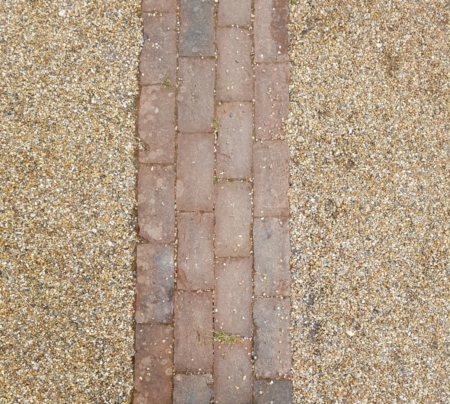
Which is more sustainable, a self-binding gravel path or a tarmac path?
Step 3: How much material is needed?
We looked at each layer separately to calculate what mass of material would be required for each square metre of footpath. As we know the area (1m x 1m) and the depth of each layer, we can calculate the volume. The EPD tells us the density of the material (kg per cubic metre). With both the volume and density, we can determine the mass of each layer.
Step 4: Adjusting the EPD data
As the EPD reports environmental impacts per tonne, and we know the mass per square metre, we can add up the impact of all the layers and adjust the EPD data for one square metre of footpath.

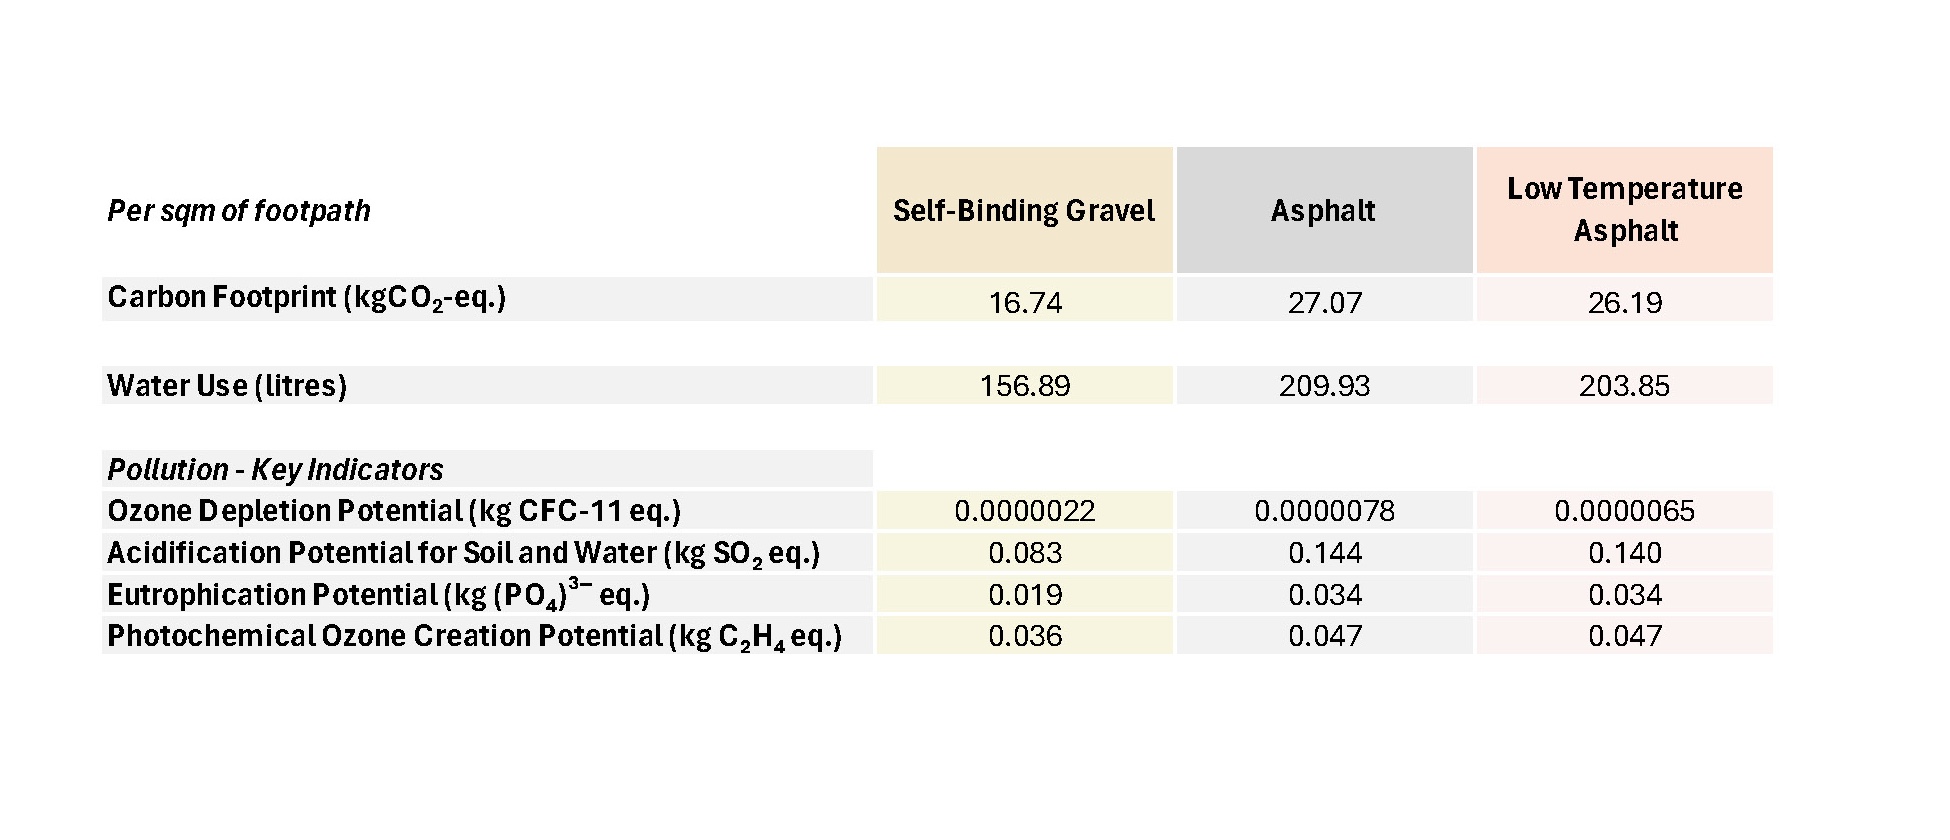
The analysis suggests a gravel footpath has a lower environmental impact than the equivalent area of asphalt. Interestingly, low temperature asphalt is not significantly better than standard asphalt in terms of carbon, water and pollution.
For context, a one-way flight from London to New York uses 300 kgCO2-eq. per person (ICAO air travel calculator), and an average sized full bath uses around 80 litres of water (Consumer Council for Water).
Step 5: Including maintenance
Longevity and repairability is an important aspect of sustainability. The lowest impact choice may not be the most sustainable if the surface needs to be replaced too regularly. When undertaking this type of analysis we also consider the lifespan of the material and maintenance requirements.
Typically asphalt is durable for around 15-25 years, however, in heat events it can degrade. When self-binding gravel surfaces are repaired, the upper gravel layer is replenished and the aggregate base typically does not need re-laying. In this comparison, we assumed a 20-year lifespan for the tarmac surface without degradation and that 10% of the surface of the gravel footpath would need repairing every year for 20 years.

Conclusion:
When annual maintenance is factored in, the environmental impact of self-binding gravel increases. However, the data show that it is still a more sustainable choice than asphalt – even over a 20-year period.
Limitations of EPDs
As EPDs are voluntary, there are still large gaps in coverage. It tends to be the larger organisations that invest in producing them, although increasingly smaller firms are seeing their value.
Many EPDs do not assess all life stages, denoted by ‘MND’ in the EPD table (‘Module not declared’) – and there is nothing to prevent organisations from leaving modules out. And as with any modelling, assumptions must be made, for example, the average transport distance from quarry to factory, the fuel efficiency of the lorry used, and so on. In our analysis, we used the average figures given in the EPD: for asphalt, transport to site is based on 31.2km, using a lorry with fuel consumption 0.471 litres/km; for aggregates, transport to site is based on 47km, using a lorry with fuel consumption 0.462 litres/km.
Despite their limitations, EPDs are an excellent tool to help us to assess the relative environmental impact of the materials we use in our projects. As more and more suppliers and manufacturers start to publish EPDs, we hope the scope for data-driven comparison will grow.
USEFUL RESOURCES
- Stockholm Resilience Centre – the Planetary Boundaries Framework: stockholmresilience.org/research/planetary-boundaries.html
- EPD International – a short introduction to EPDs: environdec.com/home
We are continuing to add to this growing resource area. To receive email updates please subscribe to our mailing list by filling in the form here: https://www.marianboswall.com/contact/


